


 and How Data Passes Through Them")


, and Neural Networks in a structured way")
")


Introduction
The Central Limit Theorem (CLT) is one of the cornerstones of statistical theory and a powerful concept in probability. This theorem explains why the normal distribution appears so often in real-world data, even when the original data doesn’t follow a normal distribution. Understanding CLT is crucial for statisticians, data analysts, and anyone working with data. In this blog, we’ll explore the Central Limit Theorem, its importance, real-life applications, and provide an example with calculations.
What is the Central Limit Theorem?
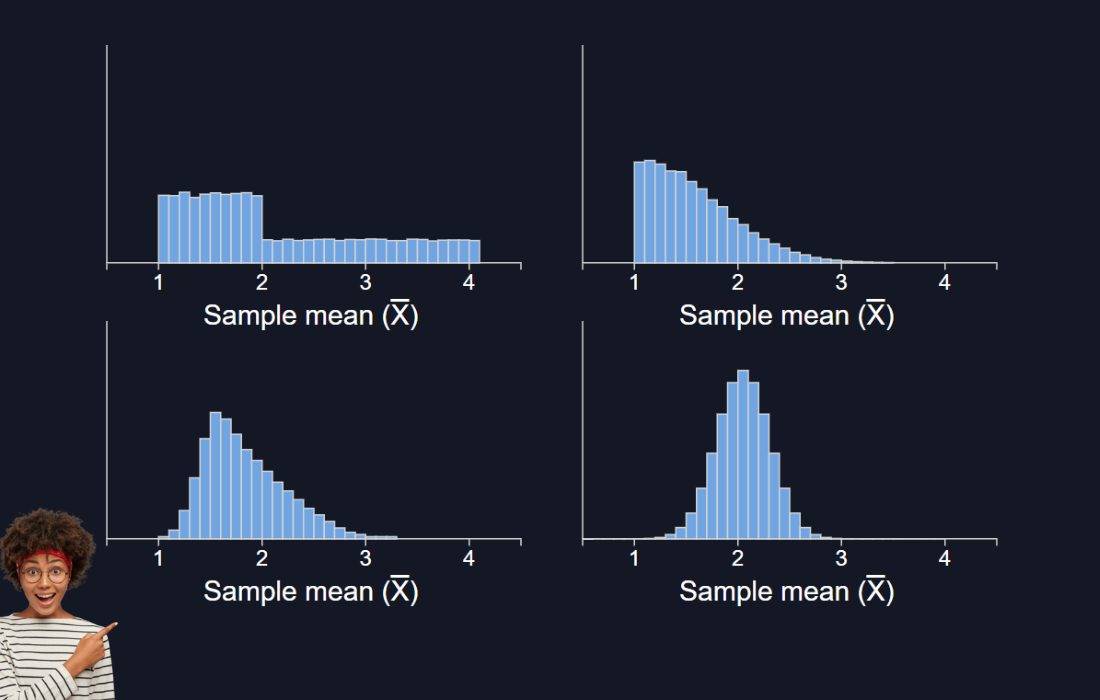
In simple terms, the Central Limit Theorem states that the distribution of the sample means from a large number of independent random samples will be approximately normal (bell-shaped), regardless of the shape of the original population distribution.
In other words, when you take multiple random samples from any population (whether the population distribution is normal or not), and calculate the means of those samples, the distribution of those sample means will approach a normal distribution as the sample size increases.
The important aspects of CLT are:
- Sample Size: The larger the sample size, the closer the sample means will be to a normal distribution.
- Sample Mean: The mean of the sample means will approximate the population mean.
- Standard Error: The spread of the sample means is narrower than the population, and it’s quantified by the standard error, which is the population standard deviation divided by the square root of the sample size.
Why is the Central Limit Theorem Important?
- Facilitates Statistical Inference:
The CLT makes statistical inference possible. It allows us to apply normal distribution techniques even if the original data is not normally distributed. This is essential for hypothesis testing, confidence intervals, and other statistical methods that require normality. - Simplifies Complex Data Analysis:
With the CLT, we don’t need to know the exact distribution of the population. As long as we have a sufficiently large sample size (usually 30 or more), the distribution of sample means will tend to be normal, simplifying our analysis. - Predictive Power:
The CLT is foundational in making predictions based on sample data. For instance, in fields like finance or manufacturing, it helps predict the behavior of large populations by analyzing small samples. - Basis for Many Statistical Tests:
Many statistical tests, including t-tests and z-tests, rely on the assumption that the sample mean follows a normal distribution. This is possible because of the CLT, which assures that, under certain conditions, sample means will be normally distributed.
CLT Calculation Example
To see the Central Limit Theorem in action, let’s walk through an example.
Problem:
Consider a population of people’s ages where the population mean age is 40 years with a standard deviation of 10 years. We want to calculate the sampling distribution of the sample mean for samples of size 25. Let’s look at the following:
- Population Mean (μ) = 40 years
- Population Standard Deviation (σ) = 10 years
- Sample Size (n) = 25
Using the CLT, the sampling distribution of the sample mean will have:
- Mean of the sample means = μ = 40 years
- Standard Error (SE) = \[
\frac{\sigma}{\sqrt{n}} = \frac{10}{\sqrt{25}} = \frac{10}{5} = 2 \text{ years}
\]
Now, let’s assume we take multiple random samples of size 25 from the population, and we calculate the means of these samples. According to the CLT:
- The distribution of these sample means will be approximately normal.
- The mean of this distribution will be 40 years.
- The standard error of the sample means will be 2 years.
Visualization of Sample Means:
If we plotted the means of multiple samples of size 25, we would get a normal distribution centered around the population mean of 40 years, with a standard error of 2 years.
Application in Real Life
- Quality Control:
In manufacturing, quality control inspectors may not measure every product produced. Instead, they take random samples of products. Thanks to the CLT, the distribution of sample averages (e.g., weight or size) will follow a normal distribution, allowing inspectors to make decisions based on the sample rather than the entire population. - Finance and Economics:
The CLT is used in finance for portfolio theory, risk management, and in economic modeling where it’s impractical to measure every element of a population, but sample data can be used to estimate population parameters. - Polling and Surveys:
In political polling or market research, the CLT helps to determine how sample data can be used to predict outcomes for a larger population.
Conclusion
The Central Limit Theorem is a foundational concept in statistics that explains why the normal distribution appears frequently in sample means, even when the original population data is not normally distributed. By understanding the CLT, we can confidently use statistical methods to make inferences and predictions based on sample data. Whether you’re working with quality control, financial analysis, or even election polling, the CLT is a powerful tool that simplifies data analysis and improves decision-making.
The next time you’re analyzing sample data, remember that the Central Limit Theorem is working in the background, allowing you to use the normal distribution even when your population isn’t normally distributed.
Let me know if you need further clarification or assistance with other statistical topics!