Learn Orange Data Mining The Easiest Way to Explore Machine Learning Visually
Unveiling the Toolbox: A Comprehensive Guide to Orange Data Mining Tools
These widgets, often referred to as "tools," each have a specific function, from loading data to training machine learning models and visualizing results.
This article provides a detailed guide to the essential tools in Orange, categorizing them by their primary role in the data analysis pipeline.
The Orange Workflow Philosophy
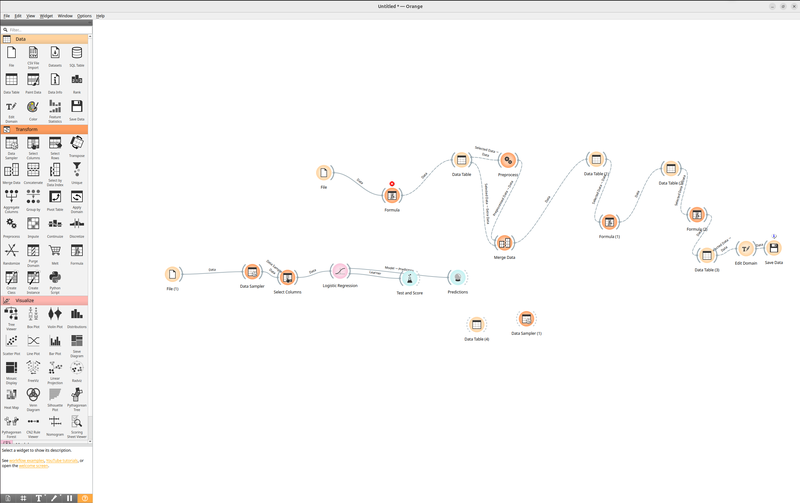
Before diving into the tools, it's crucial to understand the Orange workflow. You place widgets on a canvas and connect their inputs and outputs to create a data flow. For example, you can connect a File widget to a Data Table widget to view your data, and then connect the Data Table to a Test and Score widget to evaluate model performance. This intuitive, drag-and-drop approach makes advanced analytics accessible to non-programmers.
Category 1: Data Input and Management
These tools are the starting point of any workflow, responsible for getting data into Orange and preparing it for analysis.
* File: The most common starting widget. It reads data from various file formats, including CSV, Excel, Tab-delimited, and even remote URLs. It automatically detects variable types (categorical, numeric, text) and allows you to set the target variable for supervised learning.
* Data Table: The primary widget for viewing and inspecting your dataset. It displays the data in a spreadsheet-like format, allowing you to sort, filter, and get a quick statistical summary. It's invaluable for a first look at your data.
* SQL Table: Connects directly to a SQL database (e.g., MySQL, PostgreSQL) and imports data by executing a SQL query. This is essential for working with large, database-stored datasets.
* Concatenate: Vertically stacks two or more datasets (adding rows). Think of it as the SQL `UNION ALL` operation. Useful for combining data from multiple similar sources.
* Merge: Horizontally joins two datasets based on a key column (adding columns). This is analogous to the SQL `JOIN` operation, crucial for combining information from different tables.
Category 2: Data Preprocessing and Transformation
Raw data is often messy. This category of tools is used to clean, transform, and engineer features to make the data suitable for machine learning algorithms.
* Select Columns: Allows you to choose a subset of features (columns) to include or exclude from your dataset. This is fundamental for feature selection and simplifying models.
* Select Rows: Filters your data based on conditions (e.g., `age > 30`), allowing you to focus on specific data subsets.
* Preprocess: This is a powerhouse widget that consolidates many common preprocessing steps. It can:
* Impute Missing Values: Replace missing data with mean, median, or model-based estimates.
* Normalize and Standardize: Scale numerical features to a specific range (e.g., 0-1) or to have a mean of 0 and standard deviation of 1.
* Discretize: Convert continuous numerical variables into categorical bins (e.g., age into "Young," "Middle-aged," "Senior").
* One-Hot Encoding (Categorical Variables): Convert categorical variables into a set of binary (0/1) columns, a necessity for most ML algorithms.
* Feature Constructor: Enables you to create new features from existing ones by writing simple Python expressions. For example, you could create a `BMI` feature from `weight / (height*height)`.
* Data Sampler: Splits your data into subsets, most commonly for creating training and testing sets. It can perform simple random sampling, cross-validation folds, or bootstrap sampling.
Category 3: Visualization
Orange excels at interactive visualizations that are linked across widgets. Selecting data points in one plot automatically highlights them in all others.
* Scatter Plot: The workhorse of visualization. It plots two numeric attributes, allowing you to discover correlations, clusters, and outliers. Color-coding points by a categorical variable adds another dimension of insight.
* Box Plot: Displays the distribution of a numeric variable across different categories. It's excellent for comparing medians, ranges, and identifying outliers between groups.
* Histogram: Shows the frequency distribution of a single numeric variable, helping you understand its underlying distribution (e.g., normal, skewed).
* Distributions: A more compact way to view the distribution of multiple variables simultaneously, often colored by a class variable.
* Heat Map: Visualizes a data matrix (like a correlation matrix or a gene expression matrix) using color intensity. Great for spotting patterns in large, dense datasets.
* Mosaic Display: Specialized for visualizing the relationship between two or more categorical variables.
* Linear Projection / t-SNE / UMAP: Advanced visualization widgets for high-dimensional data. They project the data into a 2D space, allowing you to see clusters and structures that are invisible in raw, high-dimensional form.
Category 4: Machine Learning (Modeling)
This is the core predictive analytics category. Orange provides a wide array of supervised and unsupervised learning algorithms.
Supervised Learning (Classification & Regression)
* Tree: Constructs a decision tree model, which is highly interpretable. You can visually inspect the tree to understand the decision rules.
* Random Forest: An ensemble method that builds multiple decision trees and combines their results for improved accuracy and robustness.
* Logistic Regression: A classic linear model for binary classification problems.
* Linear / Ridge Regression: Models for predicting a continuous numeric outcome (regression).
* Neural Network: Offers a simple, fully-connected neural network (multilayer perceptron) for both classification and regression.
* SVM (Support Vector Machine): A powerful algorithm for finding the optimal boundary between classes, effective in high-dimensional spaces.
* k-Nearest Neighbors (kNN): A simple, instance-based learning algorithm that classifies a point based on the majority class of its 'k' nearest neighbors.
* Naive Bayes: A probabilistic classifier based on Bayes' theorem, known for its simplicity and speed.
Unsupervised Learning
* k-Means: The most common clustering algorithm. It partitions data into 'k' distinct clusters based on their similarity.
* Hierarchical Clustering: Builds a tree of clusters (a dendrogram), allowing you to explore data groupings at different levels of granularity.
Category 5: Model Evaluation and Validation
Building a model is not enough; you need to assess its performance reliably.
* Test and Score: The primary widget for model evaluation. It takes one or more learners (models) and a dataset, then performs a selected validation procedure (e.g., train-test split, cross-validation). It outputs key metrics like Accuracy, AUC, F1 Score, Precision, Recall for classification, and R2, MSE for regression.
* Confusion Matrix: Provides a detailed breakdown of a classifier's performance, showing the counts of True Positives, False Positives, True Negatives, and False Negatives. Essential for understanding the types of errors a model makes.
* ROC Analysis: Plots the Receiver Operating Characteristic (ROC) curve, which visualizes the trade-off between the True Positive Rate and False Positive Rate at various classification thresholds. The Area Under the Curve (AUC) is a key metric of performance.
* Calibration Plot: Assesses how well the predicted probabilities of a classifier match the actual observed frequencies. A well-calibrated model is crucial for risk assessment.
Category 6: Specialized and Advanced Analytics
These tools cater to specific data types and advanced analysis techniques.
* Correlation Matrix: Computes and visualizes pairwise correlations between all numeric variables in the dataset.
* PCA (Principal Component Analysis): A dimensionality reduction technique that transforms the data into a new set of uncorrelated variables (principal components), often used for visualization and noise reduction.
* Text Mining Widgets (e.g., Corpus, Preprocess Text, Bag of Words): A dedicated suite for processing and analyzing textual data. They convert collections of documents (a corpus) into a numeric format (like a bag-of-words) that can be used with standard ML models.
* Image Analytics Widgets (e.g., Import Images, Image Embedding): Designed for working with image data. They can load images, extract features using pre-trained deep learning models (embeddings), and then use those features for tasks like clustering or classification.
* Geospatial Add-on: While not in the core distribution, an official add-on provides widgets for working with geographical data, including mapping and spatial analysis.
Conclusion: The Power of Connection
The true power of Orange lies not in any single tool, but in the seamless integration between them. By connecting these categorized widgets, you can build sophisticated, reproducible data analysis pipelines without writing a single line of code. This visual approach demystifies the data science process, making it an ideal tool for education, rapid prototyping, and collaborative projects. Whether you are a student, researcher, or data analyst, understanding this toolbox is the first step toward unlocking the full potential of your data.